The Idea
Stockhub is a side project I made by myself over the summer (2020) to collect data about 'social' metrics for about 8000 securities daily. Initially it also included Robinhood's API similar to robintrack.net but that has been depreciated. I use data from popular sites where people talk about stocks such as Reddit and Twitter and for daily posts and tweets run sentiment analysis on each (Read more in "The Data" section). I also track options volume for the closest strike date for 532 securities every 5 minutes.
The GoalI made this free platform mostly as a way to learn cloud computing and full stack developement, and really just to understand for myself what it takes to
build something of this scale from start to end on a $0 budget.
Apart from that, I hope to improve my sentiment analysis model over time and use the data I collect to do research about short term moves in stocks based
on these metrics.
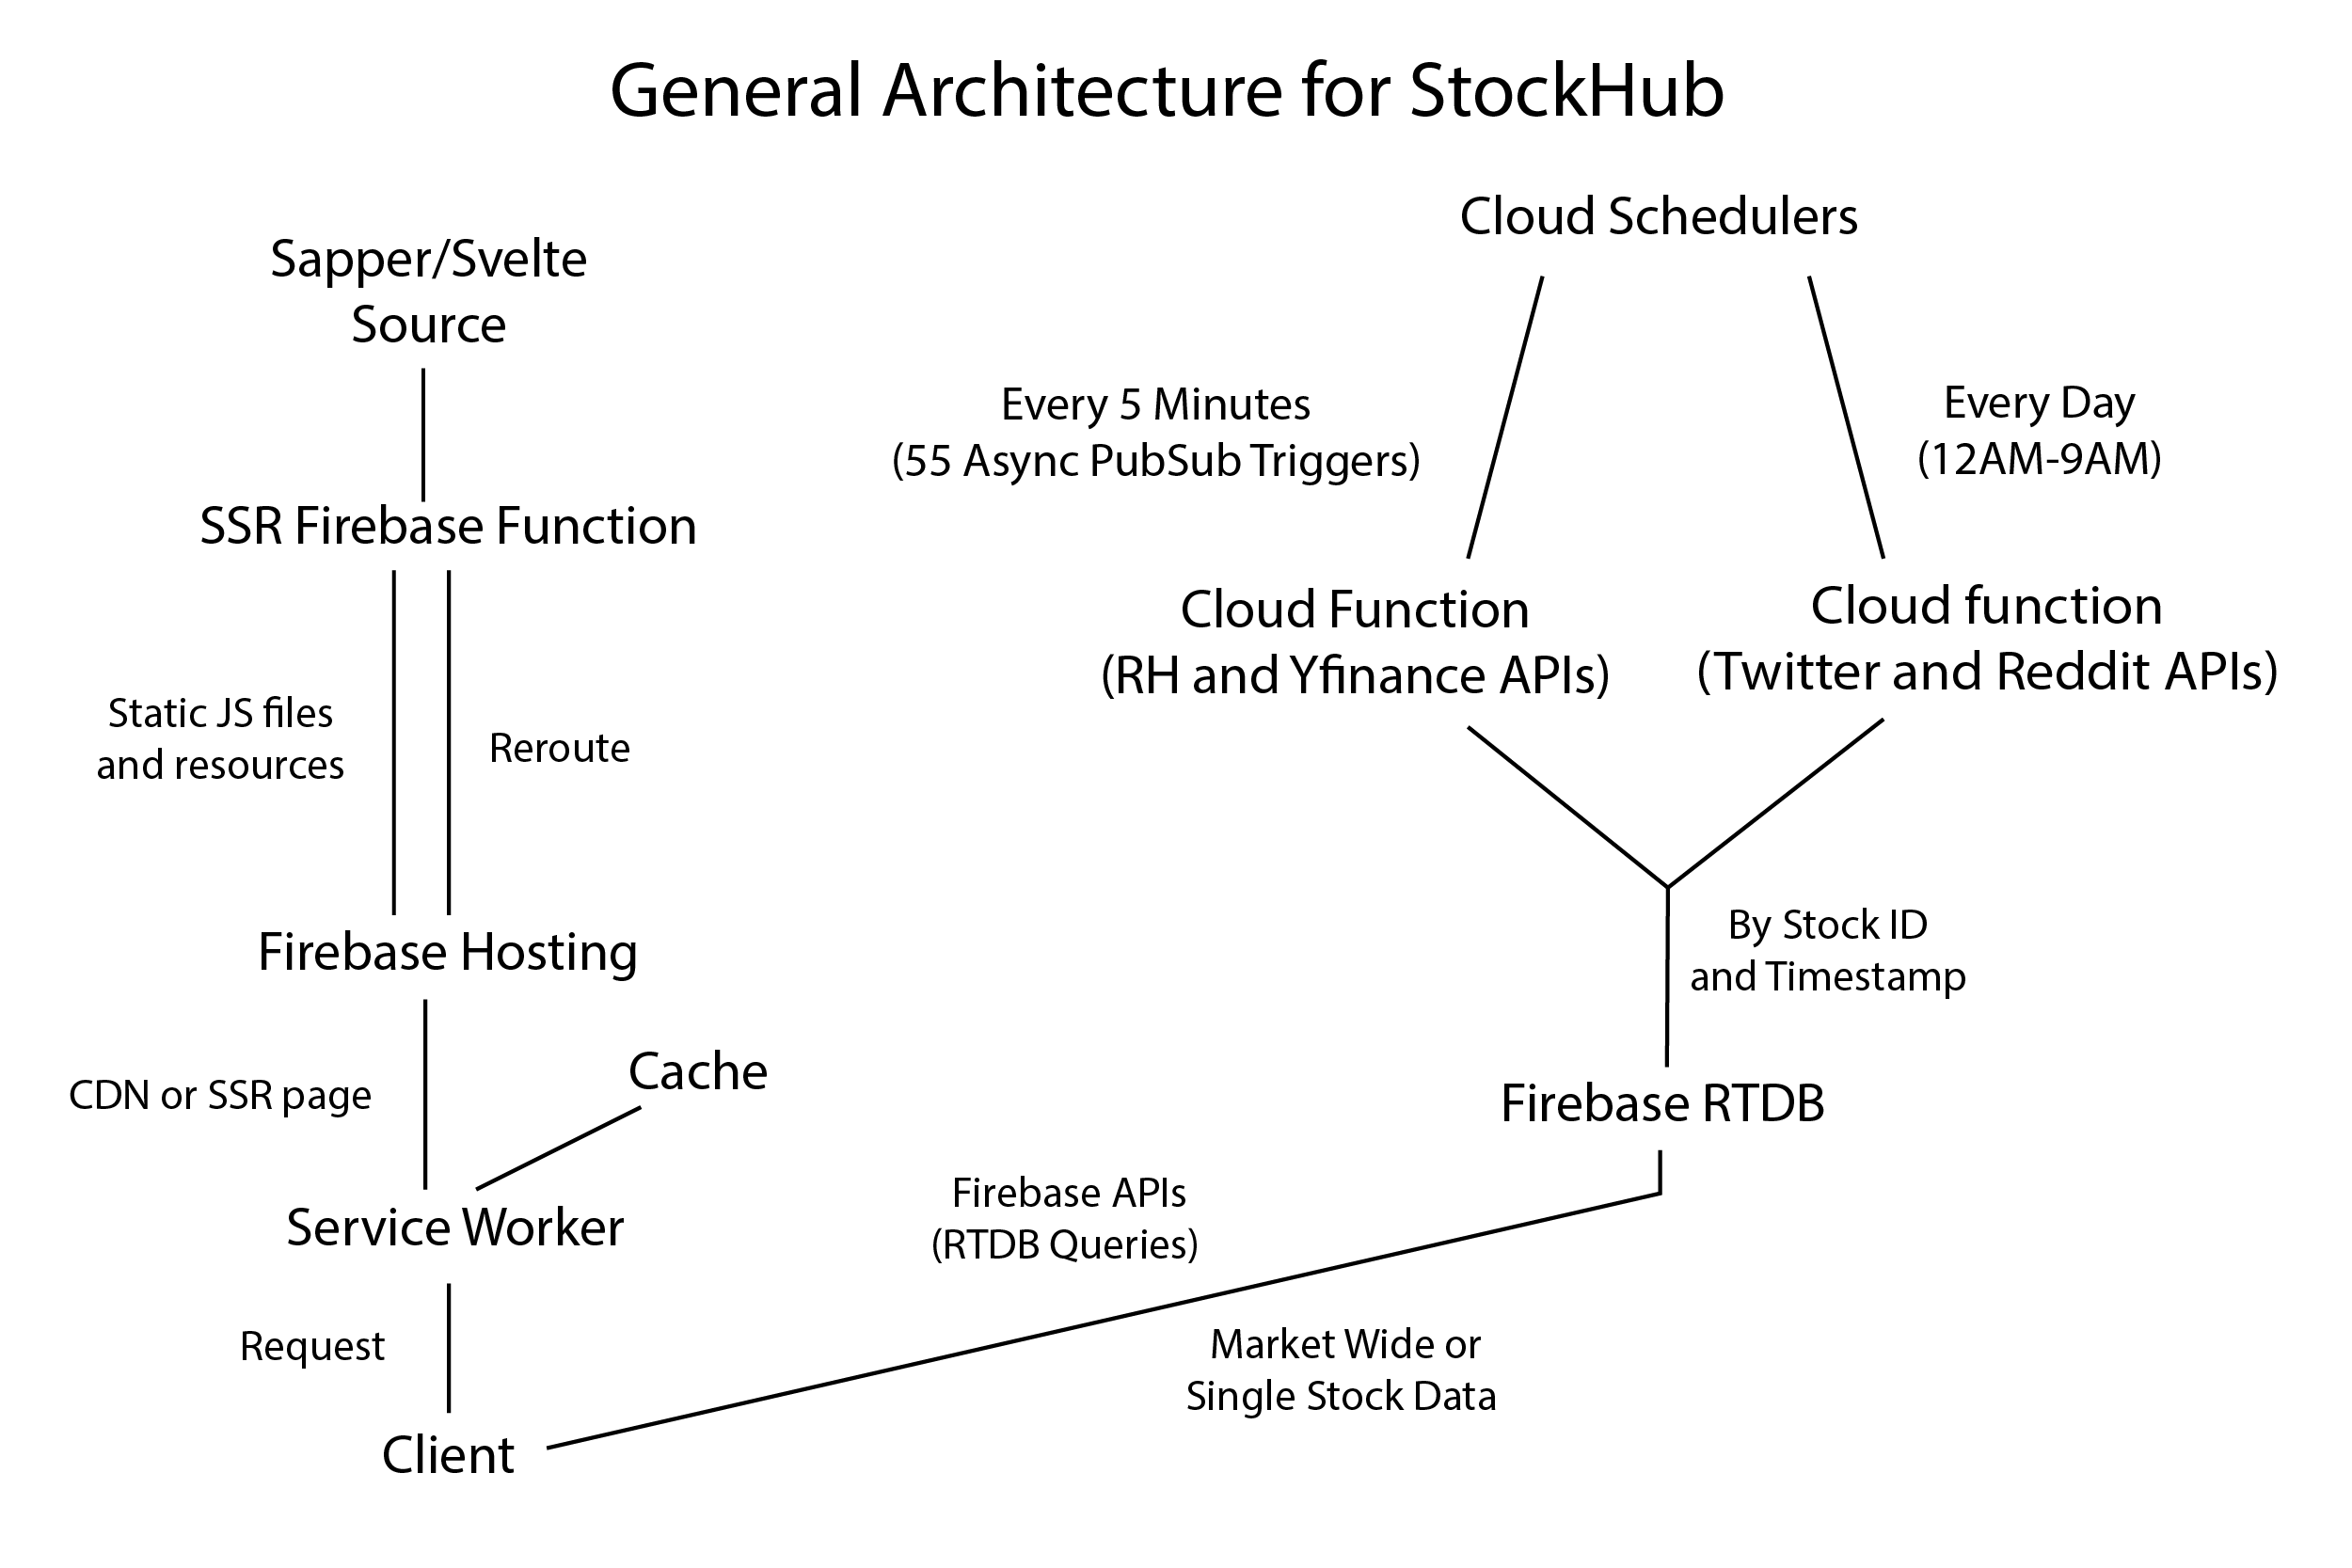
The Platform
Stockhub's backend and database are built using the Google Cloud Platform (Firebase Realtime Database, Functions, PubSub,etc.), while the frontend is built
using Svelte and Sapper! Chart.JS is used for all charts. This website is also an installable PWA! To install,
click 'install' on MacOS/PC if using Chrome, click 'Add to Homescreen' on your android device through chrome, or an iOS device through safari. Highly reccomended
for mobile devices for a much better experience.
Me
I would love to hear from you about ideas, issues or anything else! Stockhub is still in beta and so I would especially love to hear about any kind of issues you're experiencing, or anything you wish to see added that would improve your experience. You can learn more about me here.
Volume & Price
'Price' here is actually not the asking price at that moment, but instead the price of the last transaction on Robinhood. The 'Volume' data refers to the total volume of all transactions for a particular security in a given time period.
This data is collected through Robinhood for 8000 securities, and is updated every 5 mintues.
Calls & Puts
'Calls' data refers to the total number of call type contracts for the closest strike date for a given security. Same goes for 'Puts'. This derivatives data is only collected for companies in the S&P500, SPY, and a few more select companies and idecies.
This data is collected through Yahoo Finance, and is updated every 5 minutes.
Tweets, Sentiment & Subjectivity
'Tweets' refers to the number of tweets from yesterday mentioning that security (Ex: "$TSLA stock too high imo"), which also had a minimum of 5 likes and 1 reply. Any tweet that does not meet the requirements by midnight, or is posted after midnight, is not counted.
Every tweet for every company also undergoes a very basic sentiment analysis, which output a sentiment and a subjectivity score (0-100), these are then averaged for all tweets to give 'Sentiment' or 'Avg. Sentiment' and 'Subjectivity' or 'Avg. Subjectivity'. This data is collected through the Twitter API for 8000 securities, and is updated daily.
From my own testing it seems that the last two data points are only useful if they are above 50 or below -50 (I plan to improve the analysis model in the future). Note that certain symbols like ETH might be refering to other things such as cryptos with the same name.
Reddit Posts, Sentiment & Subjectivity
'Posts' refers to the number of posts from a select bunch of subreddits from the last 3 days, as returned by the API. Similar to Tweets but the data is capped to 50 posts at most for a security by Reddit. The chosen subreddits are : r/wallstreetbets, r/thetagang, r/stocks, r/investing, r/robinhood, r/options, r/newsbotBOT.
All posts undergo the same sentiment analysis as tweets. This data is collected through the Reddit API for 8000 securities, and is updated daily.
Note that this API is even dumber than Twitter's when it comes to exact key word search and so you might see tickers with names like "C" or "YOLO" have a lot of posts, but really they are just there because there is no '$' prefix to use on Reddit like Twitter.
Top Charts
The Top Charts page allows you to fetch up to 500 securities, by either 'Volume', 'Options' , 'Twitter' or 'Reddit'. This is meant to help you screen market wide data. There is also a 'Minimum' input field. Since we are only looking at the top n securities, this would help you filter results and also reduce data egress costs to the database. Note that 'Options' orders the data by number of Calls. Values in the data table can be sorted by clicking the header of any column.
Movers
The Movers page allows you to fetch up to 4000 securities, but with a lot more control and options than 'Top Charts'.
As with 'Top Charts', you can order your data by different fields. While the fields are self explanatory, some securities might be differently ranked at different timestamps, so even with n results the actualy number of records in the datatable might be lowers as after fetching 2 sets of n results I only keep the intersect. Since tweets and posts only change once a day their minimum lookback period is one day.
'Period' allows you to choose a lookback range, where '5M', '15M' and '30M' refer to 5,15 and 30 minutes respectively. This essentially lets you compare the latest values for a selected field with old ones on a market wide scale. This makes 2 queries to fetches n results from the database for the two different timestamps, and then first filters out any results that were in one of the queries but not in the other. Then, with the intersect results it calculates changes in each field and generates a fully sortable data table (Click headers to sort by that field). 'H' refers to 1 hour, 'T' refers to today (9:30 to Now), 'D' refers to one day ago, and finally 'W' refers to this current week (9:30 Monday to Now).
The 'Starting' and 'Ending' range sliders let you choose the minimum and maximum values for the 2 queries. They filter results from the first and second query respectively. Since you are limited to 4000 results, this can be very useful to filter your search even more. For example, you can set the sliders to 500 - 50000 volume, to target less popular stocks, or even the opposite like 100000 - 5000000. You can even have them be different for the two queries to track large movements between ranges. For example, you can order by 'Calls' then set the starting values to 100 - 50000, and the ending ones to 100000-250000, or literally any combination. Ideally you should never even need 4000 results. The minimum and maximum values of course change with the chosen field to order by. I highly encourage you to use these extensively as they not only help you focus your search but also save me a lot on costs.
'Relative' is just an option that locally changes all values from absolute to instead percent of change. This is local and not part of the query.